Most maintenance dashboards show activity.
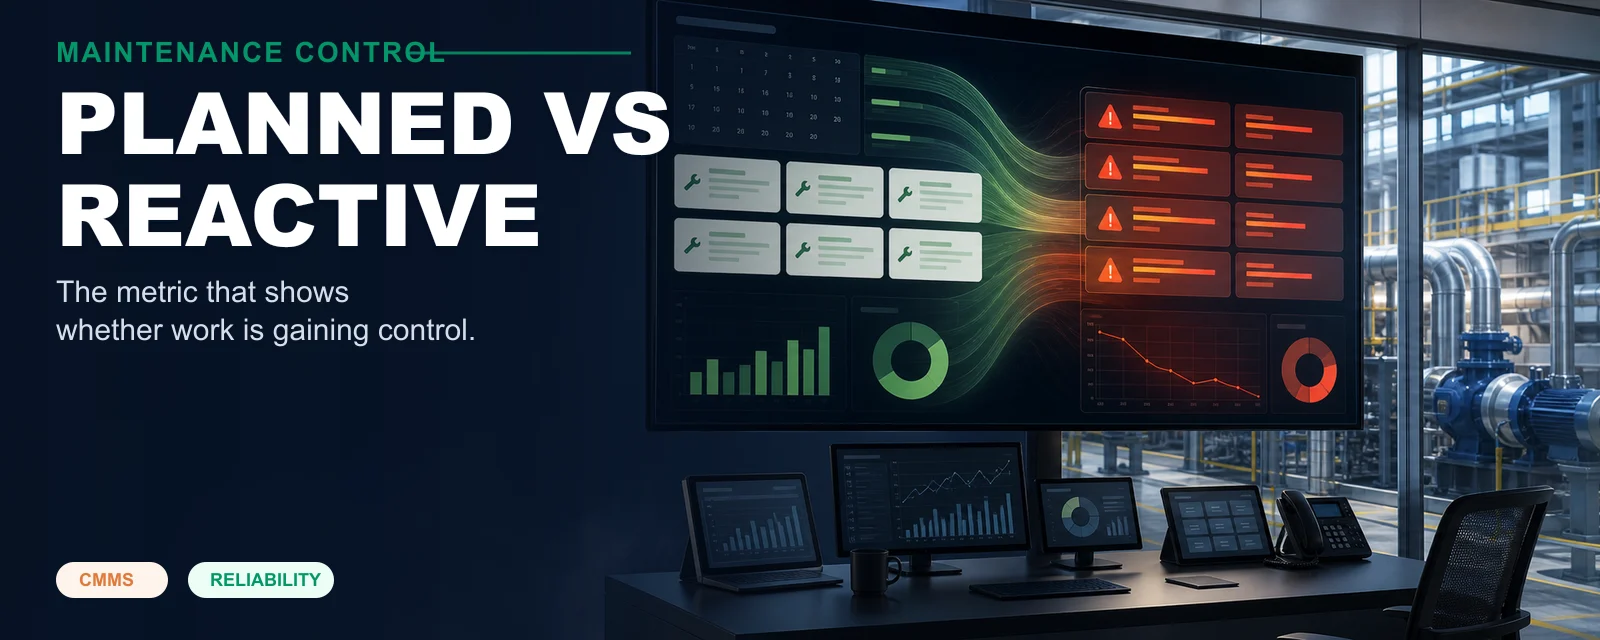
Work orders opened. Work orders closed. PMs due. PMs overdue. Labor hours. Parts spend. Backlog.
Those are useful, but they do not answer the question maintenance leaders care about most: are we gaining control of the work, or is the work still controlling us?
The planned versus reactive ratio gets closer to that answer.
What the metric means
At a simple level, the ratio compares work the team expected and prepared for against work that interrupted the schedule.
Planned work includes preventive maintenance, predictive inspections, scheduled corrective work found before failure, and other jobs where the team had time to plan labor, parts, safety, and downtime.
Reactive work is different. It interrupts the weekly schedule. It usually comes with pressure, missing parts, incomplete diagnosis, and a higher chance of temporary repair.
Not all corrective work is bad. Corrective work found through an inspection can be a sign that the PM program is working. The key distinction is control. Did the team find the defect early enough to plan the repair, or did the failure force the team to respond?
Why it predicts CMMS success
A CMMS implementation is working when it helps the organization move work from surprise to plan.
That shift shows up in the ratio before it shows up in big strategic outcomes. If PMs are better written, defects get found earlier. If job plans are useful, work takes fewer emergency detours. If parts are attached to recurring jobs, technicians show up prepared. If assets are structured well, repeat failures become visible sooner.
The ratio improves because the system is changing behavior.
If the ratio does not move, the CMMS may still be recording work, but it is not changing the operating model.
Why the number can lie
Like every maintenance metric, planned versus reactive can be gamed by accident.
If every emergency work order is marked "planned" because someone assigned it before closing it, the metric is useless. If every PM is counted as planned even when it is completed late, pencil-whipped, or missing required readings, the ratio looks better than the operation feels. If small nuisance failures never become work orders, reactive work is understated.
The metric needs clear definitions.
A good rule: reactive work is work that interrupts the agreed schedule because failure happened, failure was imminent, or service was already degraded. Planned work is work the team had time to prepare for before execution.
The definition matters more than the benchmark.
What good looks like
High-performing teams usually push toward a majority of proactive, planned, or scheduled work. Some frameworks describe proactive work as PM, predictive work, and corrective tasks identified from those inspections. That is a useful way to think about it because it rewards teams for finding defects early.
But a universal target can be misleading.
A hospital, a food plant, a school district, and a mining site have different risk profiles. A site emerging from years of deferred maintenance may look reactive for a while because the CMMS is finally revealing work that had been invisible.
The better question is trend: are we moving more work into the planned column over time without hiding real failures?
How Sympl surfaces it
Sympl · CMMS treats reactive versus planned as an operating signal, not just a report.
The ratio should be visible by site, asset class, system, team, and time period. Managers should be able to click into the work behind the number and see what is driving it. If HVAC reactive work is rising at one campus, the team should see whether the pattern is tied to a specific asset class, model, failure code, location, or PM gap.
That is where asset hierarchy and failure taxonomy matter. Without structure, the ratio is just a top-line percentage. With structure, it becomes a map.
Sympl also connects the metric back to behavior:
- PM quality, including missing readings and ultra-fast closeouts.
- Job plan coverage for recurring work.
- Parts readiness for planned tasks.
- Repeat failure patterns by asset and class.
- Corrective work created from inspections before breakdown.
The goal is not to shame teams for reactive work. Reactive work is real. The goal is to find the part of the reactive load that can be converted into planned work.
The real outcome
When the ratio improves honestly, technicians spend less time firefighting. Planners can kit parts. Supervisors can protect schedules. Finance can see where deferred maintenance is converting into emergency spend. Reliability teams can focus on patterns instead of anecdotes.
That is why this metric matters.
The CMMS is not successful because everyone logs in. It is successful when the maintenance organization has more control next quarter than it had last quarter.